




Ceejay Intelligence logo
    What we build

    Business dashboards built around your numbers.

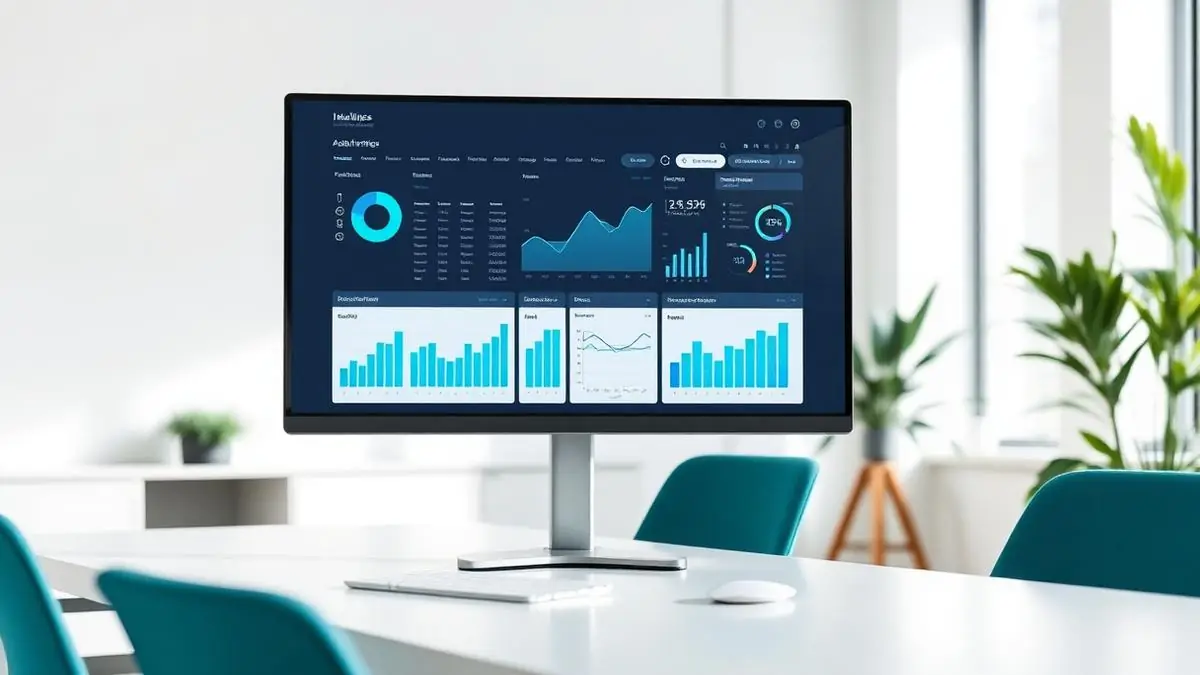
    One screen that answers the questions you currently open five spreadsheets to answer, updated live and shaped around how your business actually measures itself.

    • Live data
    • Your own metrics
    • Role based views
    • Mobile ready
    Business dashboards built around your numbers.

    Your numbers exist. They are just scattered

    Most businesses already collect everything they need. The trouble is that it lives in an accounts package, a booking tool, a CRM and a folder of spreadsheets, so nobody sees the whole picture without a morning of copying and pasting.

    • Monthly reporting is a manual export and merge exercise that eats a day.
    • Two people quote different figures for the same question because they used different sources.
    • Problems show up weeks late, after the month end pack is finally circulated.
    • Off the shelf dashboards only chart the metrics their vendor decided to expose.

    How we build it

    We start from the decisions you need to make, then work backwards to the data. Your dashboard shows your metrics, calculated your way, refreshed automatically from the systems that already hold the data.

    • Direct connections to your existing tools so figures are never rekeyed.
    • Metrics defined with you, including the awkward ones nobody else supports.
    • Drill down from a headline number to the underlying records.
    • Different views for directors, managers and front line staff.
    What you get

    Everything included, nothing bolted on

    No plugin marketplace, no upsells. Each point below ships with the plan.

    Live headline figures

    Live headline figures

    Revenue, jobs, pipeline, utilisation and whatever else drives your week, updated continuously.

    Trends and comparisons

    Trends and comparisons

    This month against last, this year against last, targets against actuals.

    Drill down detail

    Drill down detail

    Click any figure to see the customers, invoices or jobs behind it.

    Alerts and thresholds

    Alerts and thresholds

    Get notified when a number crosses a line rather than finding out at month end.

    Team dashboards

    Team dashboards

    Each role sees the view relevant to them, with permissions controlling the rest.

    Works on any device

    Works on any device

    Readable on a phone in the van, on a tablet in a meeting and on a wall screen in the office.

    Live
    Data refreshed automatically
    Days
    Typical time to a working first version
    from £2,995
    One off build cost

    Start with the decision, not the chart

    A dashboard is only useful if someone changes what they do after looking at it. In discovery we ask what decisions you make each week and what you currently guess at. Those questions become the panels. Anything that does not lead to an action gets left out, which is why our dashboards stay readable rather than turning into a wall of gauges.

    Where the data comes from

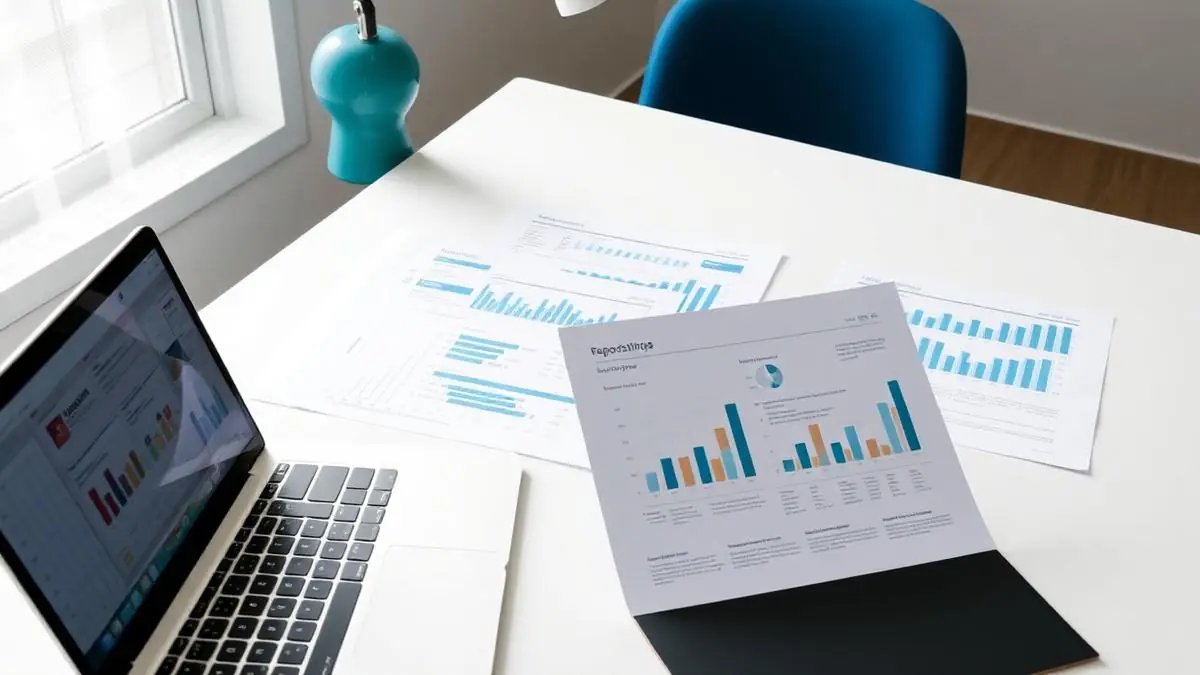
    We pull from whatever you already run: accounting platforms, payment providers, CRMs, booking systems, spreadsheets, or the operational database inside an application we built for you. Where a tool has an API we connect to it directly. Where it does not, we can import scheduled exports so the figures still land automatically.

    Built to grow with the business

    New metrics, new data sources and new views are normal as a business changes. Because the dashboard is your own application rather than a rigid product, adding a panel is a small change rather than a migration to a different platform.

    Before you ask

    The questions people actually send us

    Want your whole business on one screen?

    Tell us which questions you cannot answer quickly today and we will show you what the dashboard would look like.